Most advice on WordPress speed is a plugin checklist. Install this, tick that, minify everything, and watch the score climb.
The score often does climb. The site doesn’t always get faster for the people using it. Google doesn’t rank the number in a lab test; it looks at how real visitors experience the page, through three measurements called Core Web Vitals. Some fixes move those measurements a lot. Plenty of popular ones barely touch them.
This post sorts the two. For each metric, you’ll get what actually moves it on a WordPress site, what doesn’t, and the order we’d work in if the hours were ours.
The three numbers, and what “good” means
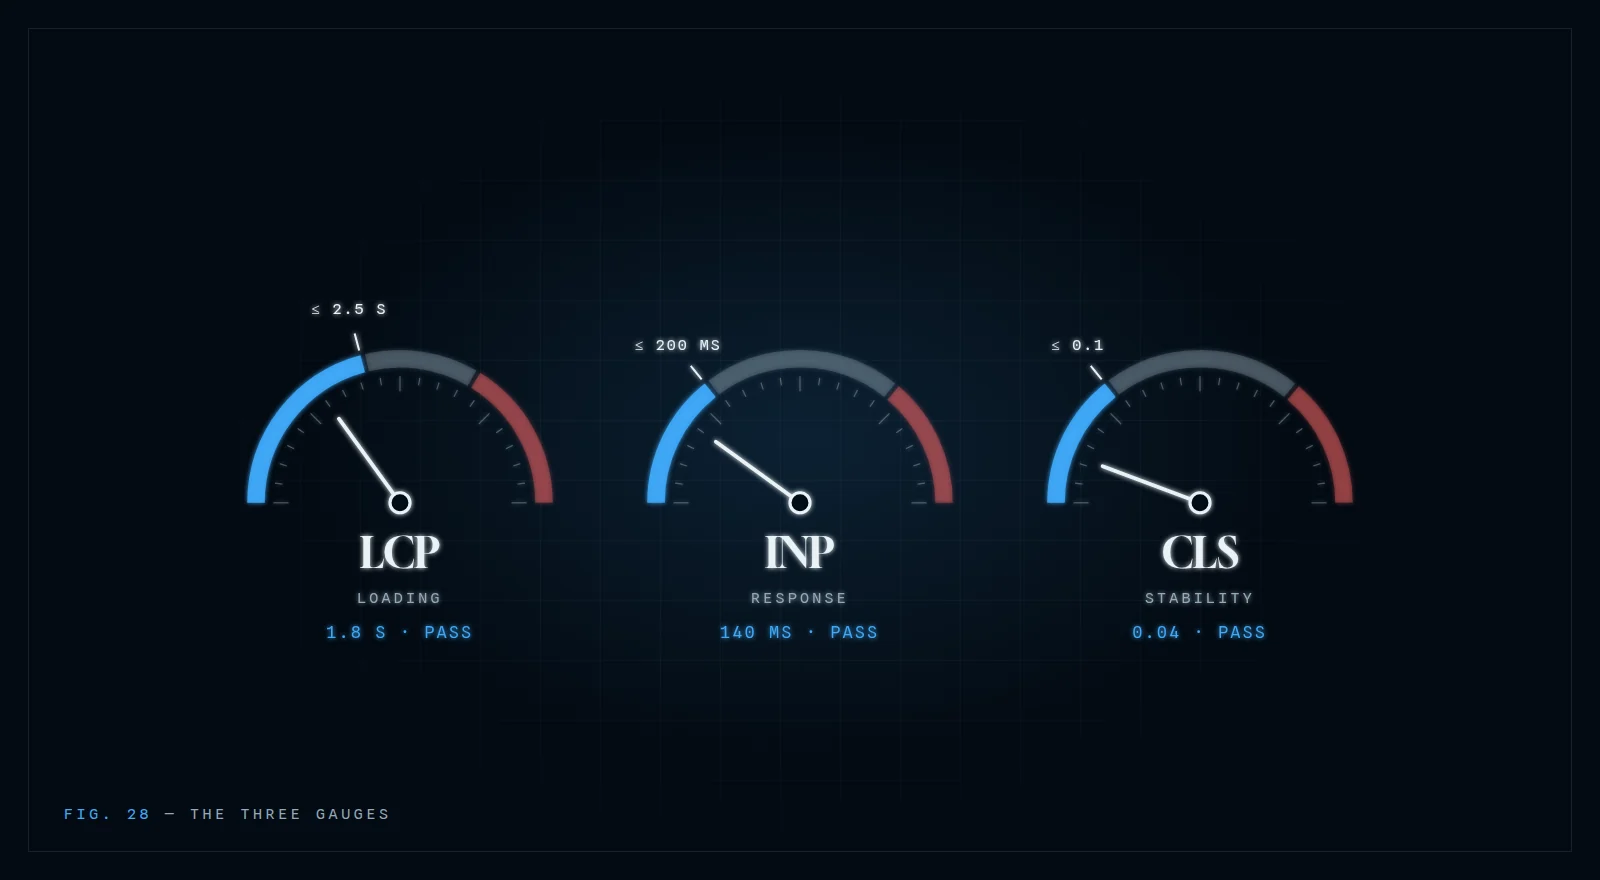
Core Web Vitals are three measurements, each covering one part of how a page feels to use:
- Largest Contentful Paint (LCP) is how long the biggest thing on screen takes to appear, usually the hero image or headline. Good is 2.5 seconds or less.
- Interaction to Next Paint (INP) is how quickly the page responds when someone taps, clicks or types. Good is 200 milliseconds or less. It replaced First Input Delay as a Core Web Vital in 2024.
- Cumulative Layout Shift (CLS) is how much the page jumps around while it loads. Good is 0.1 or less.
Google judges each one at the 75th percentile of real visits, split by mobile and desktop. In plain terms: three out of four visits need to hit the target, not your fast office connection.
Measure the right thing first
There are two kinds of speed data, and they often disagree.
Field data comes from real Chrome users visiting the site, collected over the previous 28 days. It’s what Google uses. You’ll find it in Search Console under Core Web Vitals, and in the top section of PageSpeed Insights (“Discover what your real users are experiencing”). Small sites sometimes don’t have enough traffic to show it.
Lab data is a single simulated visit on a throttled phone. It’s the familiar 0–100 score lower down in PageSpeed Insights, and it’s useful for diagnosing problems. But it isn’t what your client’s rankings are measured on.
So start with the field data. If it’s already green, the lab score is a diagnostic tool, not a target. If it’s red, the lab report tells you where to look.
LCP: what actually moves it
LCP is usually the metric that fails first on WordPress, and it’s usually one of four things.
1. Server response time. Nothing can appear until the server sends the page. On WordPress, that means decent hosting and full-page caching, so most visitors get a ready-made HTML file instead of waiting for PHP and the database to build one. This is often the single biggest LCP win on a slow site.
2. The LCP image itself. Find out which element is the LCP (PageSpeed Insights names it), then:
- Don’t lazy-load it. Lazy loading is right for images further down the page and wrong for the one at the top. WordPress, page builders and caching plugins all add lazy loading automatically, so check that the hero image is excluded.
- Size it properly. A 2,400px image squeezed into a 700px slot costs download time for nothing.
- Use a modern format. WebP is usually far smaller than JPEG or PNG at the same quality.
- Give it priority. Adding
fetchpriority="high"to the LCP image tells the browser to fetch it before less important files.
3. Render-blocking CSS and fonts. The browser won’t draw the page until it has the CSS. Page builders and themes can ship a lot of it. Remove unused stylesheets from plugins you’ve switched off, and load only the font weights you actually use.
4. Anything that hides the hero. Sliders, fade-in animations and “reveal on load” effects can delay the moment the main element counts as painted. A static hero almost always beats a slider for LCP.
INP: what actually moves it
INP is about JavaScript. When someone taps a button, the browser has to finish whatever script it’s running before it can respond. The more script on the page, the longer the queue.
On WordPress sites, the usual culprits are:
- Third-party scripts: chat widgets, heatmaps, review badges, social feeds, multiple analytics tags. Each one was added for a reason, and many are no longer used. Remove what isn’t earning its place, and load the rest after the page is interactive where the tool allows it.
- Heavy interface plugins: sliders, mega menus, popups and animation libraries that load on every page, even where they aren’t used.
- Tag manager sprawl. A tag manager makes adding scripts easy, which is exactly how sites end up with thirty of them. Audit the container.
Image compression, caching and CDNs do very little for INP. It’s almost always a script problem.
CLS: what actually moves it
Layout shift happens when something arrives late and pushes content out of the way. The fixes are specific:
- Set width and height on images and embeds, so the browser saves the right amount of space before they load. WordPress does this for images in posts, but custom templates and page builders don’t always.
- Handle font swaps. When a web font replaces a fallback font of a different size, text reflows. Preload the main font files, and choose fallbacks with similar proportions.
- Reserve space for late arrivals. Cookie banners, promo bars and ad slots that push content down are classic CLS sources. Overlay them, or give them a fixed slot from the start.
What barely registers
These show up in almost every speed checklist. None of them is harmful, but on their own they rarely change a Core Web Vitals result:
- Minifying HTML. It saves a few kilobytes that compression mostly saves already.
- Removing query strings from static files. An old tip that makes no meaningful difference to load time today.
- Disabling emojis and embeds. Tiny scripts. Fine to switch off, but not a fix.
- Stacking optimization plugins. Two caching or minification plugins doing the same job tend to conflict, not add up.
- Chasing a 100 lab score. Going from 92 to 100 in the lab rarely changes what real visitors experience. Time spent there is better spent on the field data.
The order we’d work in
If a client site is failing, this is the order that usually gets the most back for the hours:
- Check the field data in Search Console to see which metric is failing, and on which templates.
- Fix server response: hosting and full-page caching.
- Fix the LCP element on the main templates: no lazy loading, correct size, WebP, high priority.
- Cut third-party and unused scripts for INP.
- Add dimensions and reserved space for CLS.
- Retest the lab report to confirm, then watch the field data over the next 28 days.
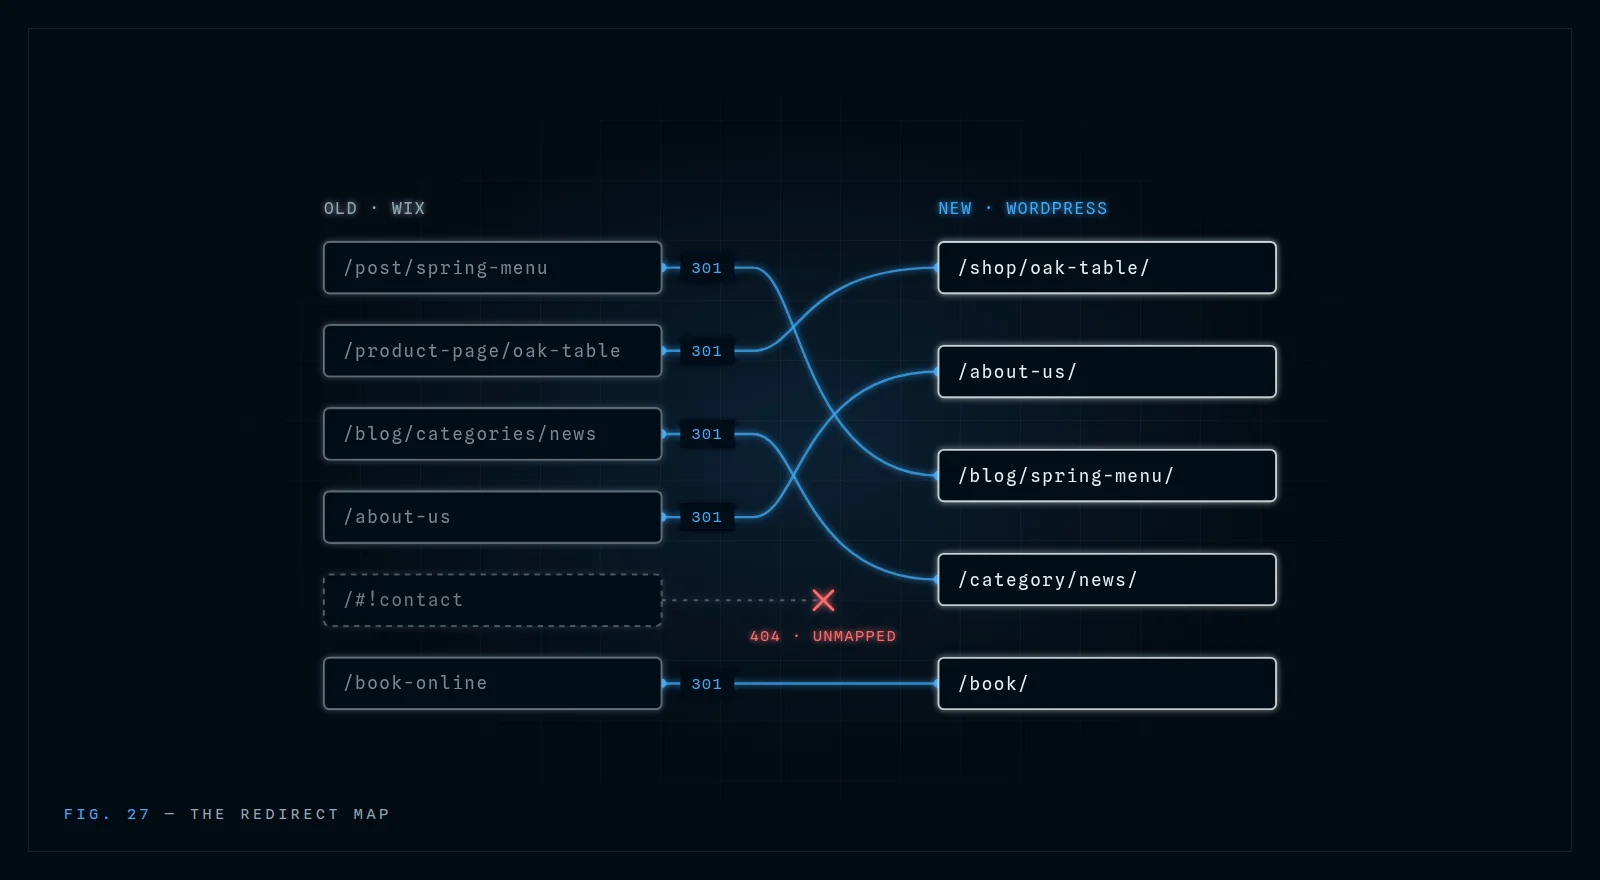
If you’re moving a client to a new build anyway, that’s the cheapest time to get all of this right from the start. Here’s how to do the move without losing their rankings.
How we handle it
We run Core Web Vitals work for agencies on sites we built and sites we didn’t: a fixed quote after the audit, a before-and-after report you can send your client, and 30 days of monitoring after the work is done. It all goes out under your agency’s name. See how our white-label site speed optimization works →
Frequently asked questions
What are good Core Web Vitals scores?
Google’s targets are a Largest Contentful Paint of 2.5 seconds or less, an Interaction to Next Paint of 200 milliseconds or less, and a Cumulative Layout Shift of 0.1 or less. They’re measured at the 75th percentile of real visits, separately for mobile and desktop, so three out of four visits need to meet each target.
Do Core Web Vitals affect Google rankings?
Yes, but they aren’t the main factor. Google says Core Web Vitals are used by its ranking systems, and also that it always tries to show the most relevant content, even when page experience is poor. Good scores help most when competing pages are similarly relevant. They won’t lift a page whose content doesn’t answer the search.
Why does PageSpeed Insights disagree with Search Console?
They usually show different kinds of data. Search Console and the top section of PageSpeed Insights show field data from real Chrome users over the previous 28 days. The 0–100 score lower down is lab data from a single simulated visit on a throttled phone. Google uses the field data, so treat the lab score as a diagnostic tool.
How long until fixes show up in Search Console?
Field data covers the previous 28 days of real visits, so improvements appear gradually as new visits replace old ones. Expect up to about four weeks before a fix is fully reflected. When you use “Validate fix” in Search Console’s Core Web Vitals report, it also monitors the affected pages over a 28-day period.